Please be aware that these numbers are in flux during the winter epidemic. They are a guide only.
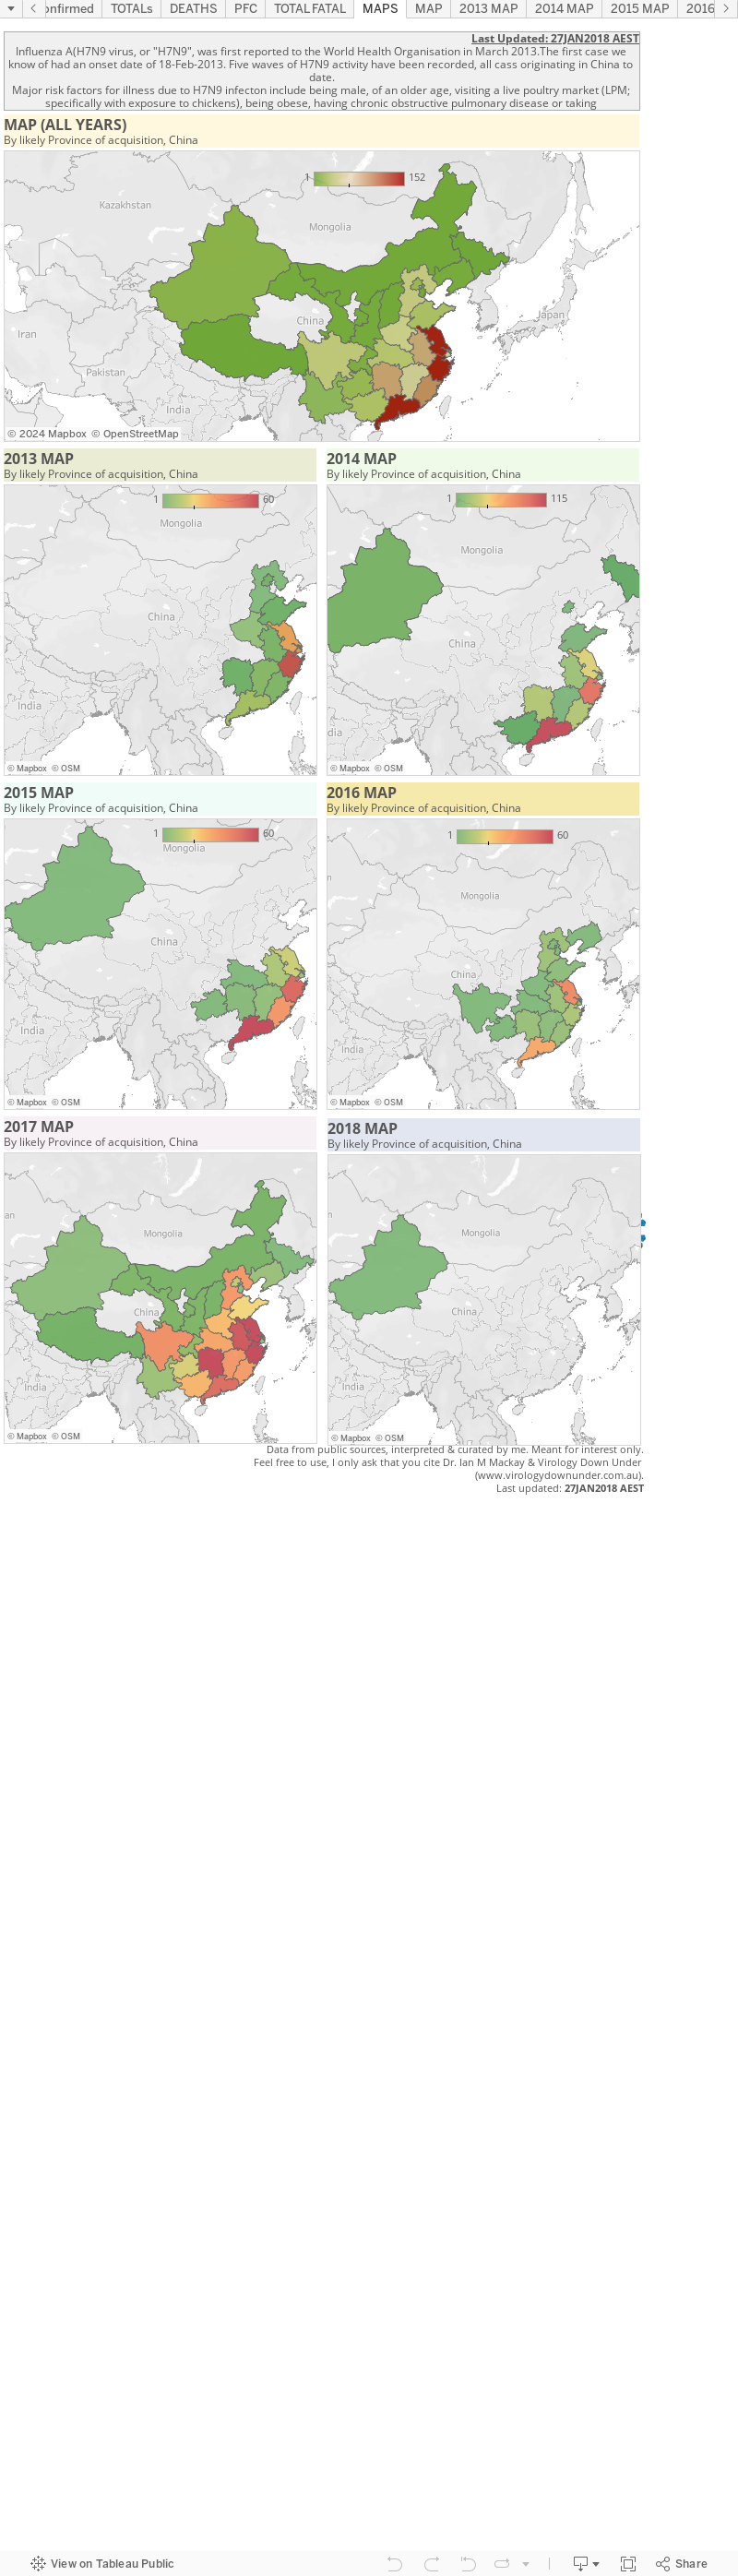
There is also an accompanying map page which for now is located here.
Reminders:
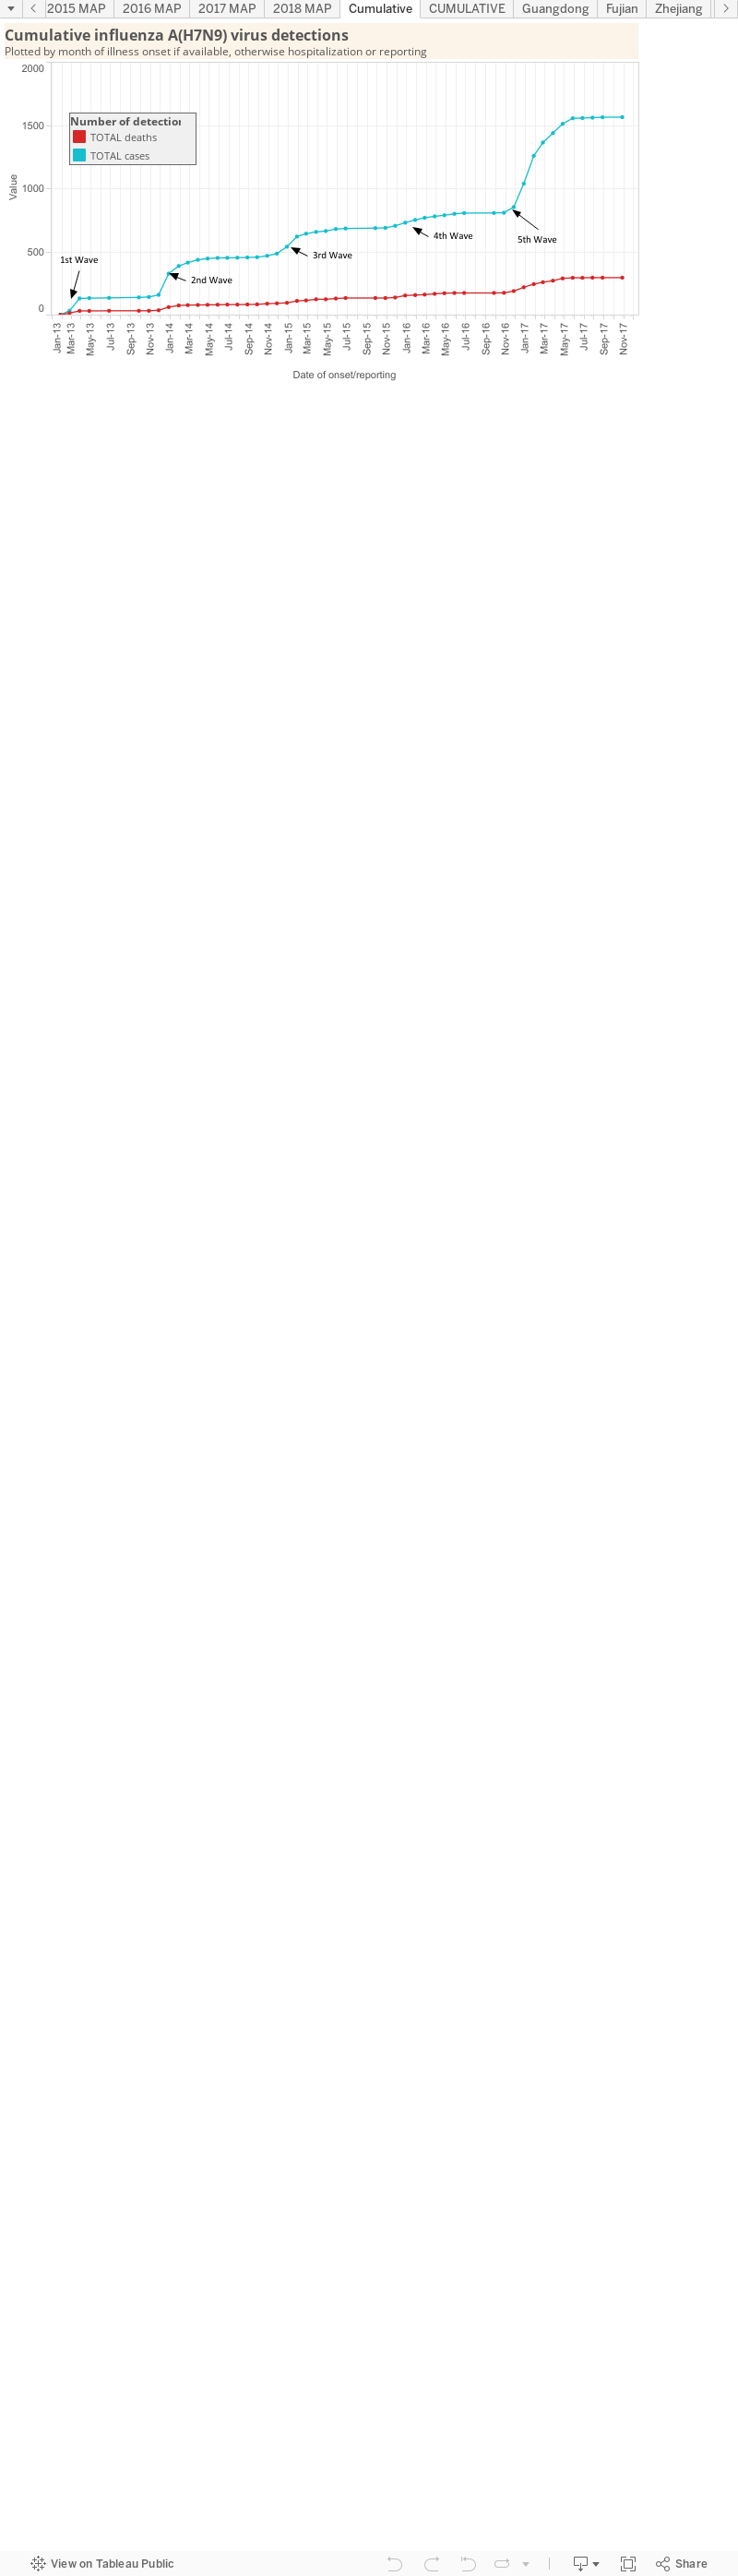
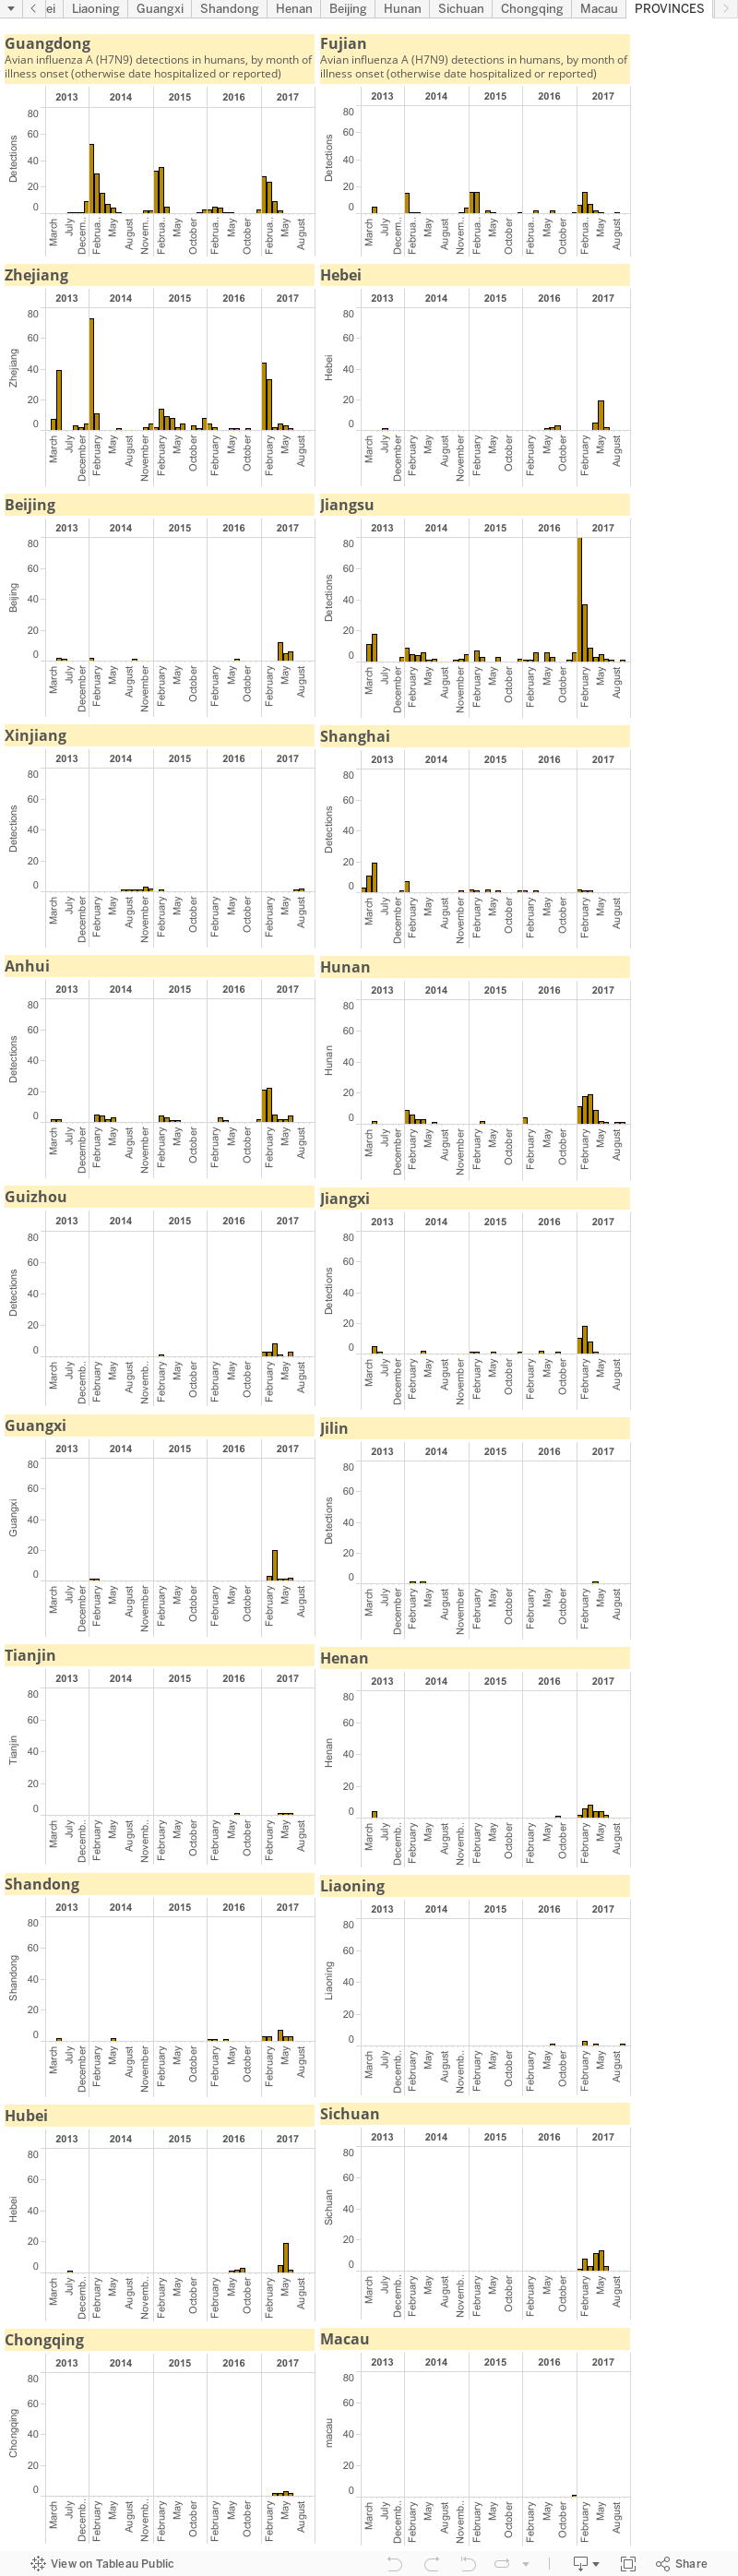
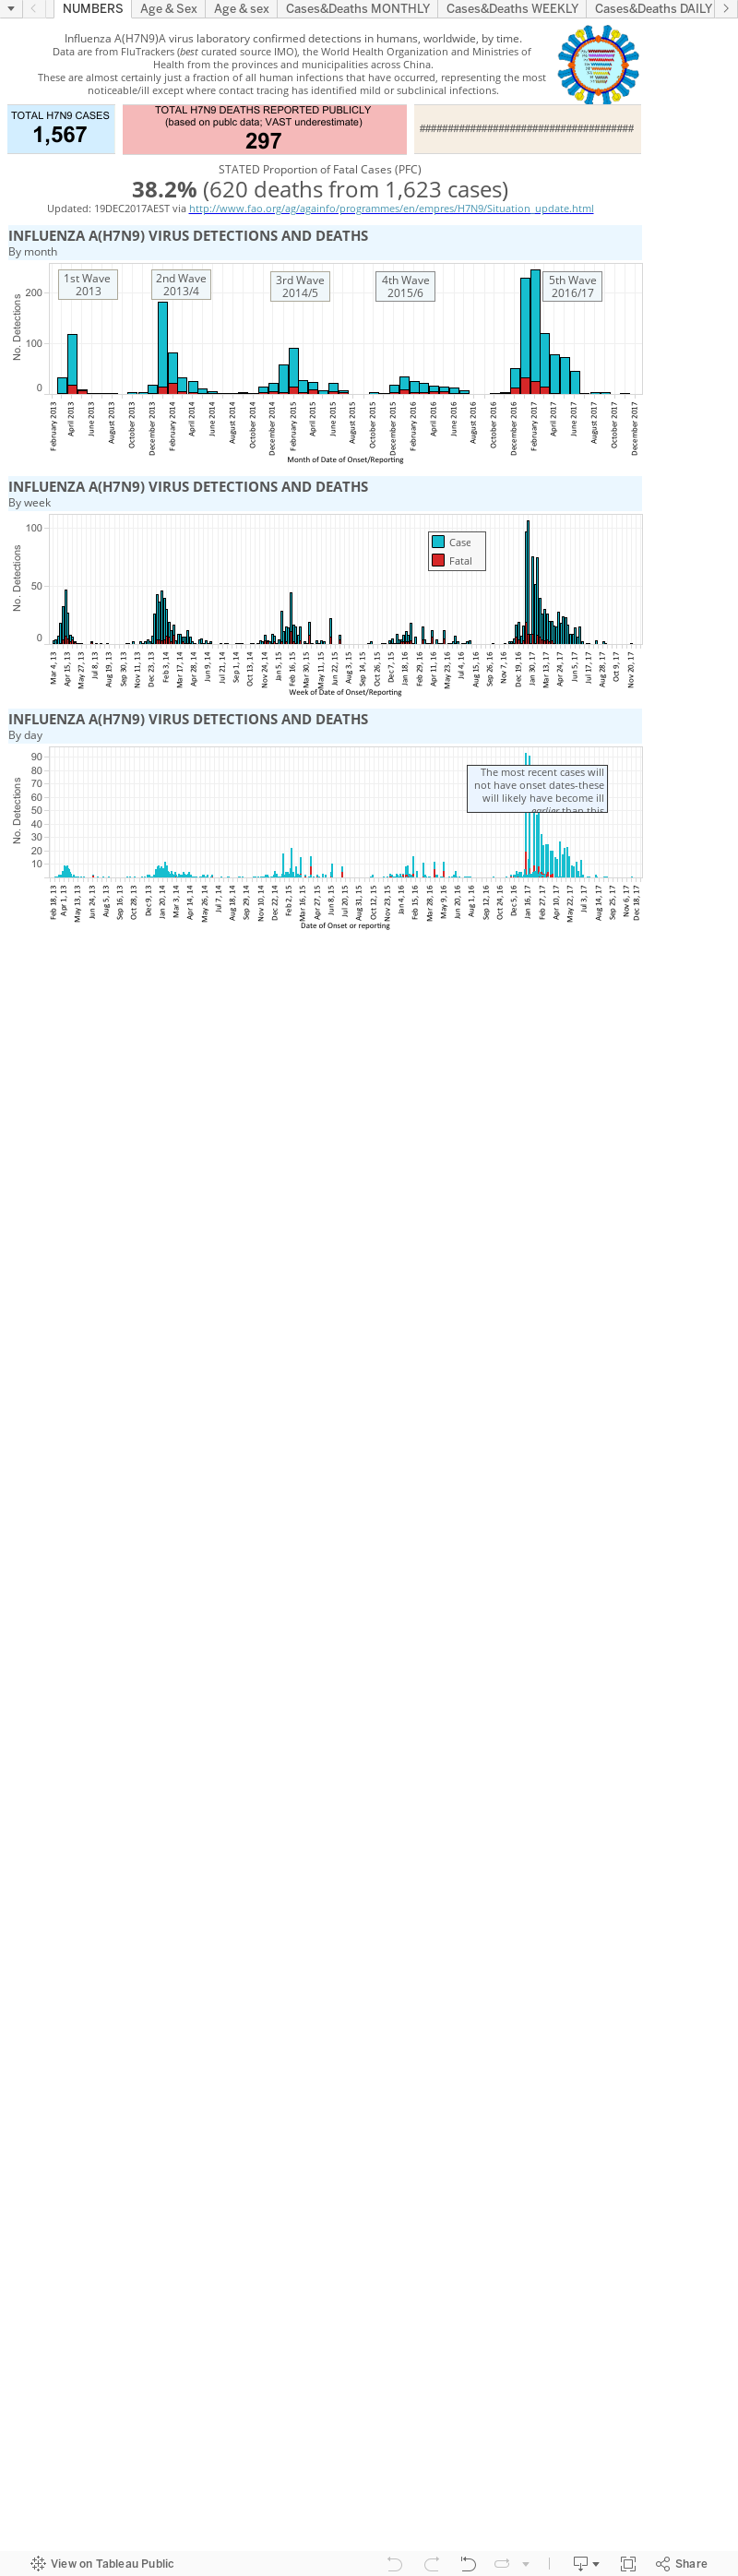
- The graphs above, as with all on VDU, are made for general interest only. They are also freely available for anyone's use, just cite the page and me please. The data can be downloaded by clicking on the "Download" link at the bottom-right of each dashboard. It may be that I have misinterpreted the language in the reports (sometimes a little tricky to wade through) or miscalculated some totals based on the way data have been presented.
- In any outbreak, epidemic or pandemic caused by a know or emerging pathogen, the numbers presented publicly, and used in these graphs, are expected to represent only a fraction of all the cases that have and are occurring. This is just the nature of the imperfect biological'ness of these events.
- I am only able to plot what is publicly available-you could do this too. No secret associations or back-room deals provide me with these data.
No comments:
Post a Comment
Note: only a member of this blog may post a comment.